Welcome to the Current Inventory Level Report user guide! This report provides a comprehensive overview of your inventory levels for each product and variant, giving you the insights you need to make informed business decisions.
With this report, you can quickly view your inventory levels across all your locations and warehouses, as well as see the quantity of each variant in different locations. You can also see which products are on-hand, committed, available, and incoming, helping you to manage your inventory more effectively.
In addition to the inventory data, the report also includes product information such as the product name, variant title, warehouse, vendor, attribute, image, SKU, barcode, product status, type, and tag.
This guide will walk you through how to access and use the Current Inventory Level Report to make the most of this powerful inventory management tool. Let’s get started!
Accessing and navigating the Current Inventory Level Report
To access the Current Inventory Level report, navigate to the Reports Library in your account and click on the “Inventory Tracking” category. Alternatively, you can use the search function by typing “Current inventory level” into the search box on the header.
Once you have accessed the report, you will find that it is organized into three main sections. The first section allows you to customize the report settings and filter data based on your specific needs. You can select a date range, add filters, choose a comparison period, and set other parameters to refine the data displayed in the report.
The second section displays a summary of the report as a chart or table, which you can customize according to your preference. You can choose to display the chart as a big number, table, bar chart, line chart, or other types of chart. This section provides a high-level overview of the inventory levels for each product, location, or other relevant metrics.
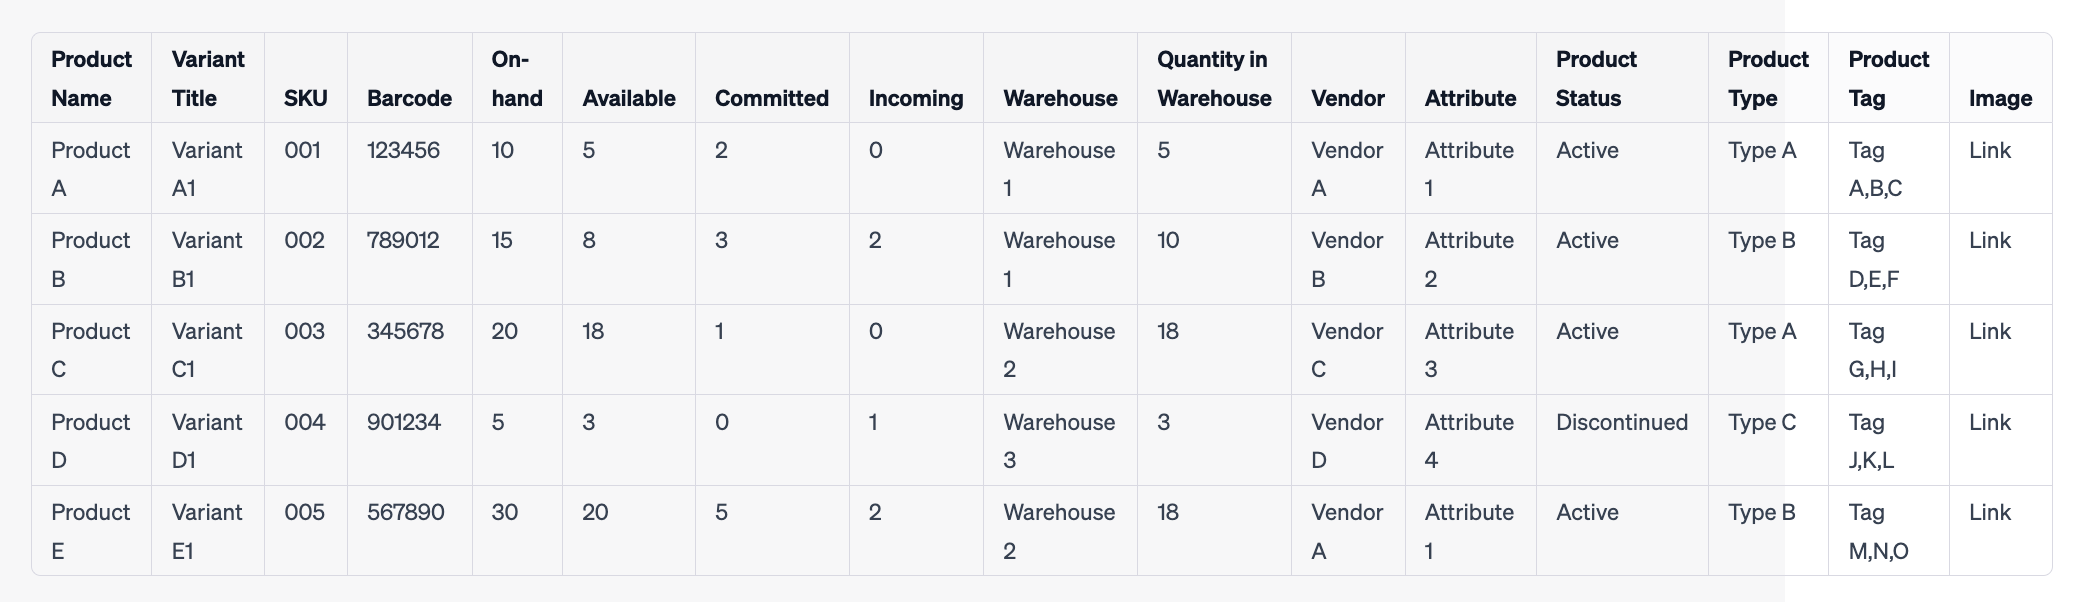
The third section is the detailed data table, which displays all the relevant inventory information such as the product name, variant title, warehouse, vendor, attribute, image, SKU, barcode, product status, product type, and product tag. You can change the order of the columns or add and remove columns to customize the report. Moreover, you can download the data in CSV, PDF, or Google Sheets formats to further analyze the data or share it with other team members.
Report Overview
The Current Inventory Level Report provides a comprehensive view of your inventory levels by product, location, and other relevant metrics. The report is organized into several key sections that help you track your inventory and make informed decisions about your stock levels.
At the top of the report, you’ll find a product image, the product name, and the variant title. These details make it easy to quickly identify the products you’re tracking.
Next, you’ll see the inventory levels for each variant, including the On-hand, Committed, Available, and Incoming quantities. These metrics are essential for tracking your stock levels and ensuring that you have enough inventory to meet customer demand.
The report also includes a breakdown of the quantity of each variant in different warehouses, allowing you to track your inventory levels across multiple locations. The Warehouse and Quantity in Warehouse columns are grouped together for easy comparison.
Other relevant information such as the Vendor, Attribute, SKU, Barcode, Product Status, Product Type, and Product Tag are also included in the report to provide additional context and insights.
Overall, the Current Inventory Level Report provides a complete picture of your inventory levels and helps you make data-driven decisions about your stock levels.
Understanding the Data
The following key data points are included in the report:
On-hand: The total quantity of a product variant currently in stock across all warehouse locations.
Committed: The total quantity of a product variant that has been allocated to orders but not yet shipped.
Available: The total quantity of a product variant that is available for sale, taking into account current stock levels and outstanding orders.
Incoming: The total quantity of a product variant that is expected to arrive in the warehouse soon.
Quantity in each warehouse: The quantity of a product variant in each warehouse location.
Product name: The name of the product.
Variant title: The specific variant of the product, such as color or size.
Warehouse: The name of the warehouse where the inventory is located.
Vendor: The name of the vendor who supplies the product.
Attribute: The specific attributes of the product, such as size or color.
Image: The product image.
SKU: The unique stock-keeping unit for the product.
Barcode: The barcode associated with the product.
Product status: The current status of the product, such as “active” or “discontinued”.
Product type: The category or type of the product.
Product tag: Any tags associated with the product to help organize and filter products in the report.
Use-cases
Here are some examples or use cases that can help you better understand how to interpret the data in the Current Inventory Level Report:
- Understanding product availability: Users can view the “Available” column in the report to understand how many units of a particular product are available for sale. If the available quantity is low, users may need to reorder stock or adjust their marketing and sales strategies.
- Managing inventory across multiple locations: Users can view the “Quantity in Warehouse” column to see how many units of a particular product are in each warehouse. This information can help users manage inventory across multiple locations and ensure that they have sufficient stock in each warehouse.
- Analyzing sales trends: Users can use the “Incoming” column to view the expected stock for each product in the near future. This can help users make informed decisions about inventory management and sales strategies based on sales trends.
- Identifying product trends: Users can use the “Product tag” column to group products by category or other relevant attributes. This can help users identify product trends and adjust their inventory or marketing strategies accordingly.
- Tracking vendor performance: Users can use the “Vendor” column to track vendor performance and ensure that they are receiving high-quality products from reliable sources. This information can help users make informed decisions about vendor partnerships and inventory management.
Using the Report for Inventory Management
The Current Inventory Level Report is a powerful tool for managing your inventory effectively. Here are some practical tips on how to leverage the report to make informed decisions:
Analyze the data: The report provides you with a detailed view of your inventory levels, including on-hand, committed, available, and incoming quantities, as well as warehouse and location data. Use this information to identify patterns and trends in your inventory levels and make informed decisions about which products to order, how much inventory to carry, and where to stock products.
Monitor stock levels: By keeping a close eye on the on-hand, available, and incoming inventory levels in the report, you can ensure that you always have enough inventory to fulfill orders without overstocking. This can help you optimize your ordering and restocking processes.
Manage inventory across product variants: The report provides a detailed view of inventory levels for each product variant. Use this information to manage inventory across variants and ensure that you are always adequately stocked for each product.
Analyze inventory trends: By analyzing inventory levels over time, you can identify trends in demand for different products or variants. Use this information to make informed decisions about pricing, marketing, and inventory management strategies.
Set inventory targets: With the report’s detailed data, you can set inventory targets for each product or location. This helps you ensure that you always have the right amount of inventory on hand to meet customer demand without overspending on inventory storage.
Optimize warehouse and location utilization: Use the warehouse and location data in the report to optimize your inventory storage. This can help you reduce the costs of storing and shipping products, and improve customer satisfaction by ensuring products are available for fast delivery.
Regularly review and update the report: Inventory levels change frequently, so it’s important to regularly review and update the report to ensure you have the most accurate and up-to-date information. This will help you make informed decisions about your inventory management.
By following these best practices and leveraging the insights gained from the report, you can optimize your inventory levels and improve your overall inventory management.
Troubleshooting
Issue: Report data is inaccurate or missing.
Possible solutions:
Force Sync: We provide a tool that allows users to force sync the data to get the latest updates. To do this, click on the “Force Sync” button located next to the name of the report.
Check report filter: Check the report filter to ensure that the data is being filtered correctly. This could be a common reason why data appears to be missing or inaccurate.
Cross-check with Shopify backend: Cross-check the information in the Shopify backend to ensure that it matches the data in the report.
If none of the above solutions work or if you have any other technical issues, please contact our technical team for further assistance.
FAQs
Q: How frequently is the data updated in the report?
A: We update the report data hourly for paid users, and free users will see the latest available data whenever they view the app.
Q: What should I do if I notice that the report data is inaccurate or missing?
A: First, check the report filter to ensure that the data displayed is correct. You can also try clicking the “Force Sync” button (located beside the report name) to get the latest data. If the issue persists, you can cross-check the data with the information in your Shopify backend. If you are still experiencing issues, please contact our technical team for assistance.
Q: How can I use the report to optimize my inventory levels?
A: Use the report to identify slow-moving products and adjust your inventory levels, pricing, or marketing strategies for those products to improve sales. Additionally, use the report to monitor stock levels and prevent stockouts by setting reorder points and safety stock levels.
Q: Can I download the report data?
A: Yes, you can download the data in CSV, PDF, or Google Sheets format.
Q: How can I customize the report to fit my specific needs?
A: Use the report filters to customize the data displayed in the report based on your specific needs. You can also reorder columns or add/remove columns in the detailed data table to make the report more relevant to your business.
Conclusion
In conclusion, the Current Inventory Level Report is a powerful tool that can help you manage your inventory more effectively. By providing real-time data on inventory levels, locations, and other relevant metrics, you can make informed decisions about your inventory strategy and optimize your operations for maximum efficiency.
We encourage you to explore the different sections of the report, including the data filtering and sorting options, summary charts, and detailed data tables, to gain valuable insights into your inventory performance.
If you encounter any issues or have any questions while using the report, please refer to the Troubleshooting and FAQs section for guidance. Alternatively, you can reach out to our support team for further assistance.
Thank you for choosing our app to manage your inventory, and we hope that the Current Inventory Level Report will help you achieve your inventory goals.